CONTACT US
568-3-53 (3rd Floor) Kompleks Mutiara 3 1/2 Mile, Jalan Ipoh 51200 Kuala Lumpur, Malaysia 6012-9714904 support@yohz.com https://www.yohz.com
Copyright © 2005 - 2024 Yohz Software, a division of Yohz Ventures Sdn Bhd. ALL RIGHTS RESERVED.
All trademarks or registered trademarks are property of their respective owners

Products
Access OLE Export
Access OLE Import
DB Doc
PgComment
SQL BAK Explorer
SQL Blob Export
SQL Data Analysis
SQL File Import
SQL Image Viewer
SQL Multi Select
DICOM Search
Easy DICOM Viewer
Easy DICOM Search
Easy Clipboard
Easy Excel Analysis
Easy Explorer
Easy PDF Explorer
Easy PDF Search
Easy Photo Search
PdfToXls
Tool for EV3 Programmers

Data analysis made
easy with
SQL Data Analysis
•
import data sets from your databases using SQL queries
•
analyze your data sets using analysis tables and pivot tables
•
discover new patterns and trends from your analysis
•
share your discoveries using PDF reports, or export to Excel,
HTML, and XML files

Get started with SQL Data Analysis
Turn your SQL data sets into actionable
information - try SQL Data Analysis free for 14
days

Got a question?
If you need help, or have any questions about
SQL Data Analysis, please get in touch.
support@yohz.com

Download a free 14-day trial now, and experience how easy it
is to discover new insights from your SQL Data Analysis.


Get actionable insights from your SQL data sets
the fast and easy way
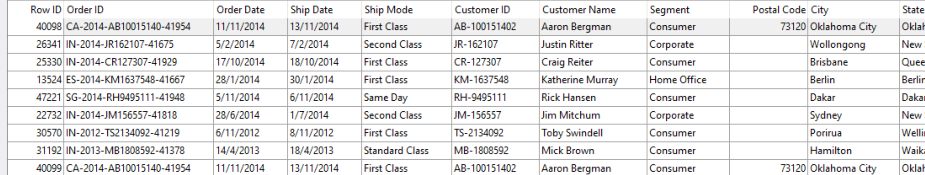
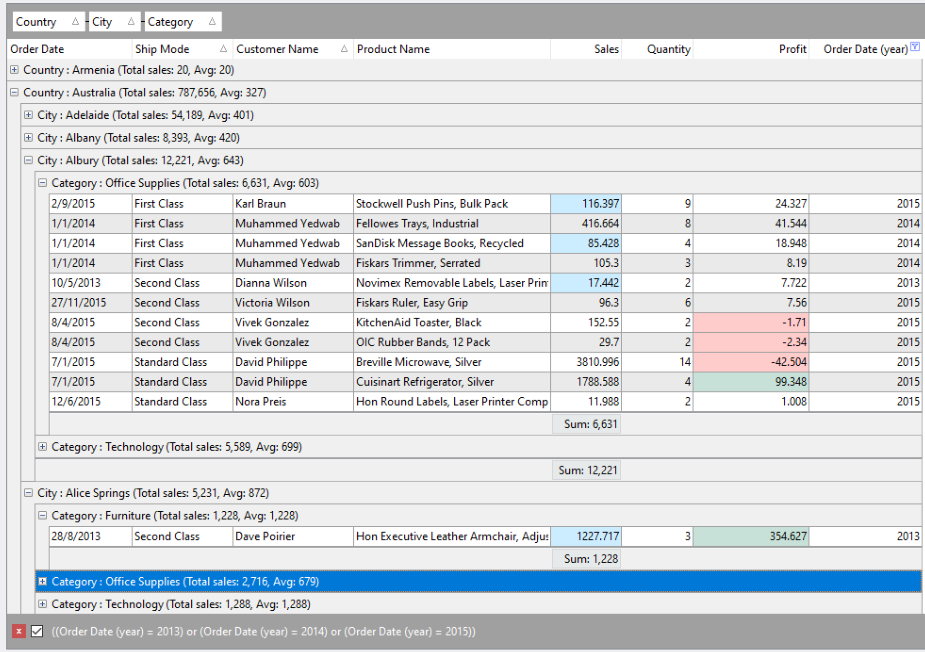
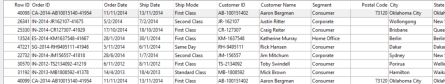
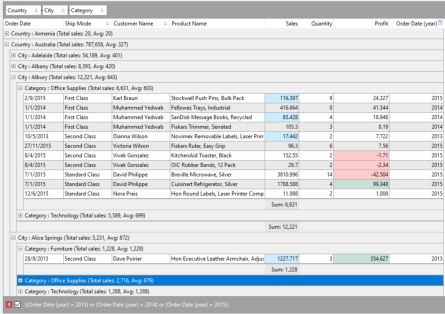
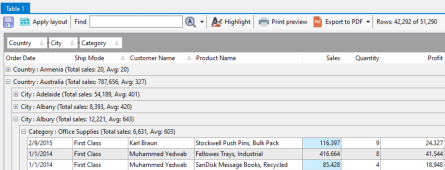
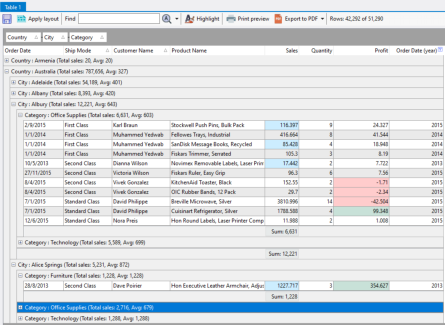
Sort, filter, group, and summarize your SQL data sets whichever way YOU need. Transform this:
into this:
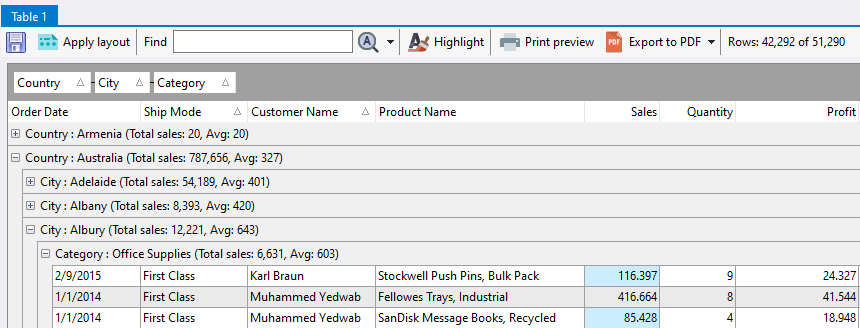
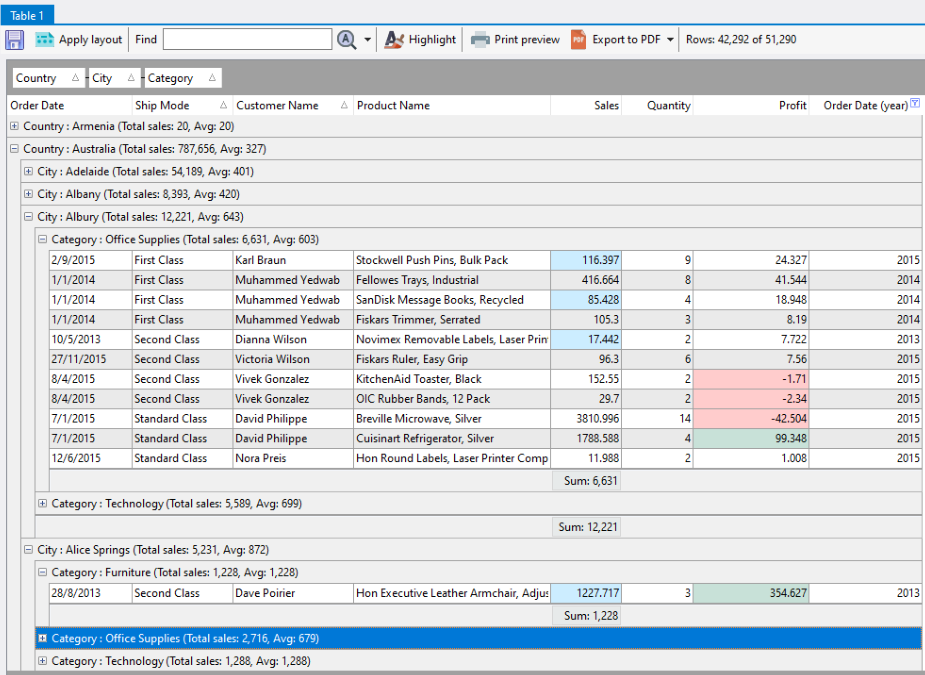
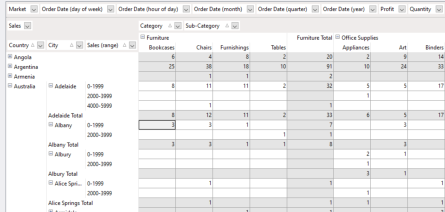
Grouping
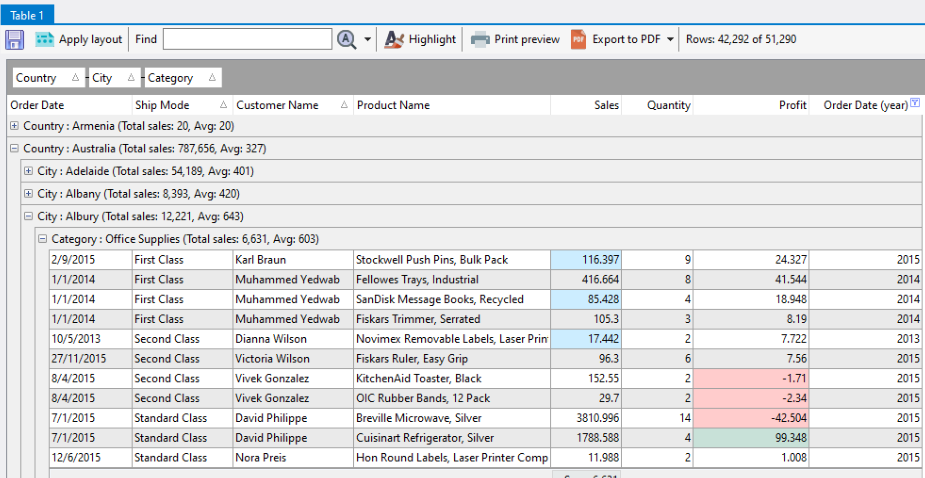
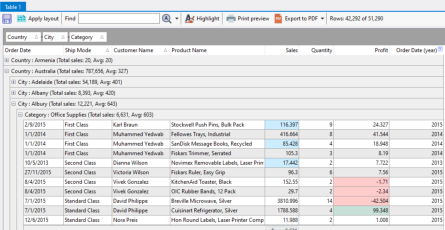
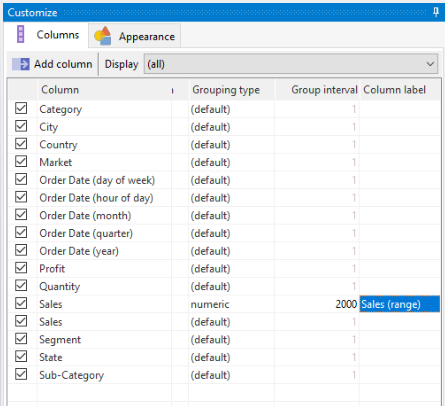
You can group columns in whichever order you require. This allows you to summarize your data in many possible ways, potentially uncovering new information or patterns.Summaries
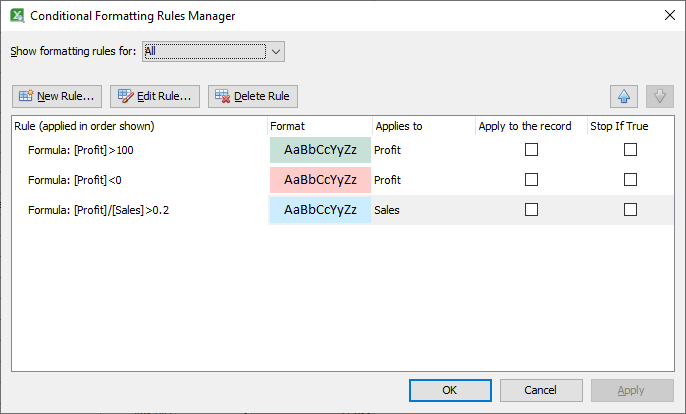
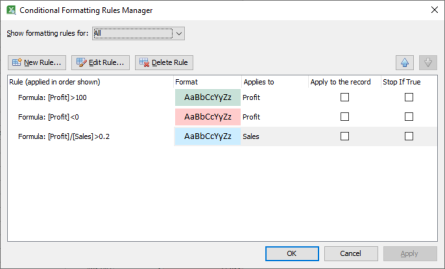
Create summaries for any columns, or even multiple summaries for the same column using different functions. View summaries in group headers, group footers, and column footers.Conditional highlighting
Highlight exceptional values using flexible rules and formulas.Sorting
Sort one or more columns in ascending or descending orders, in the sequence you require. In our example, the data is first sorted by Ship Mode, then by Customer Name. The groups (Country, City, Category) are also currently sorted in ascending order.Filtering
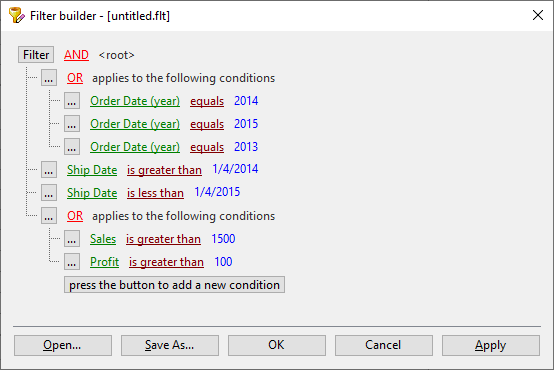
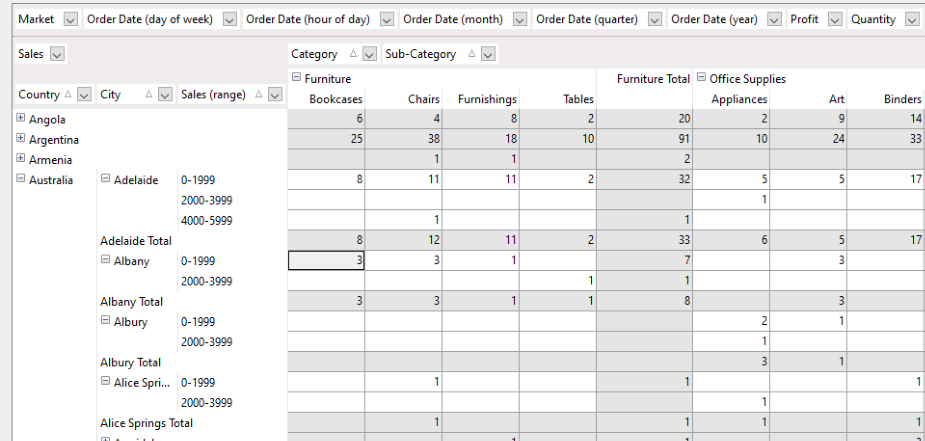
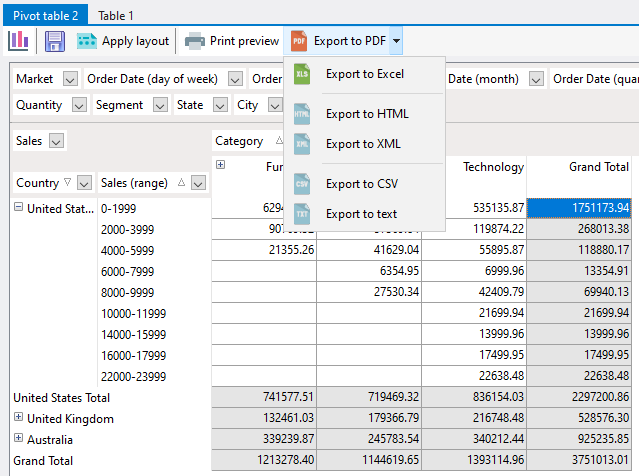
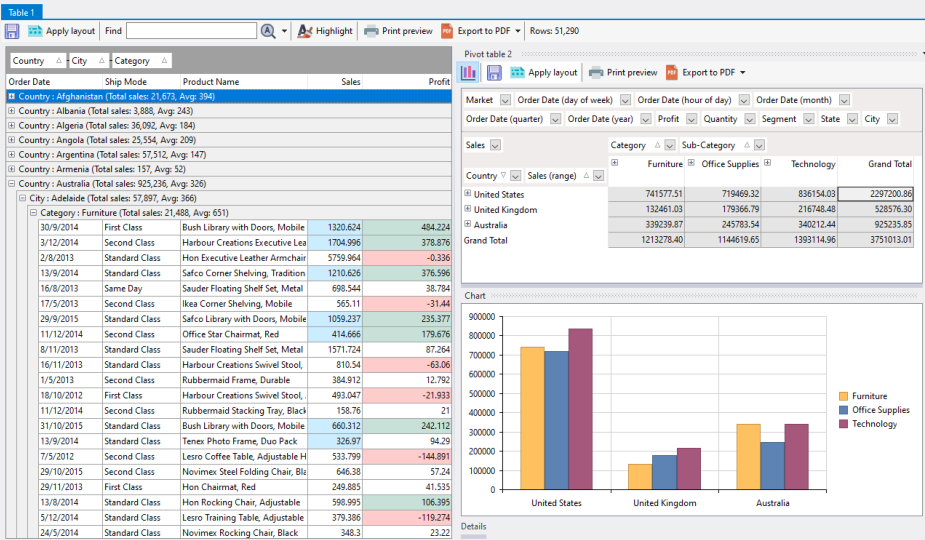
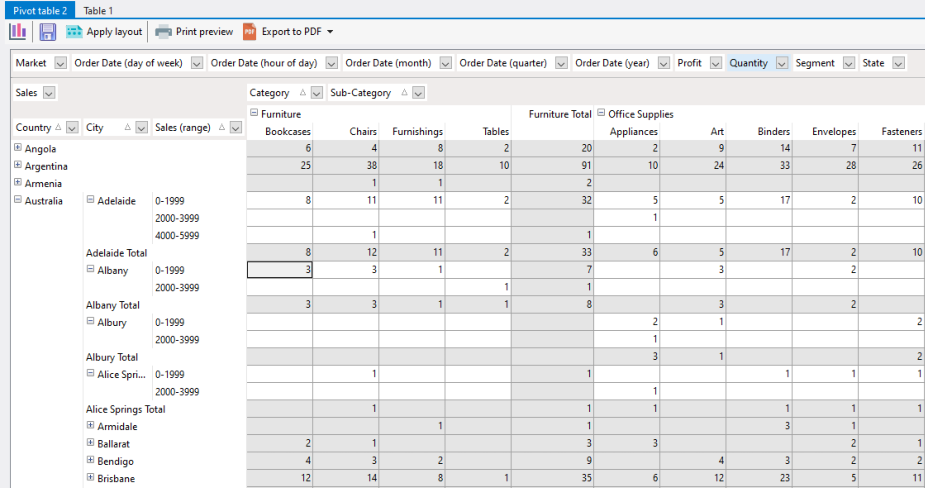
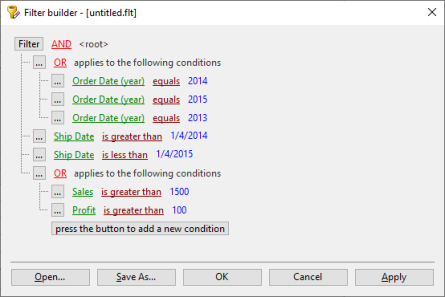
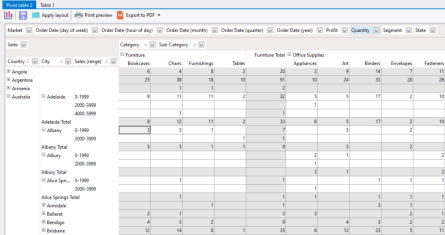
Each column can be filtered to display only the data you want to see. You can also apply more complex filtering rules.Pivot tables - new dimensions revealed
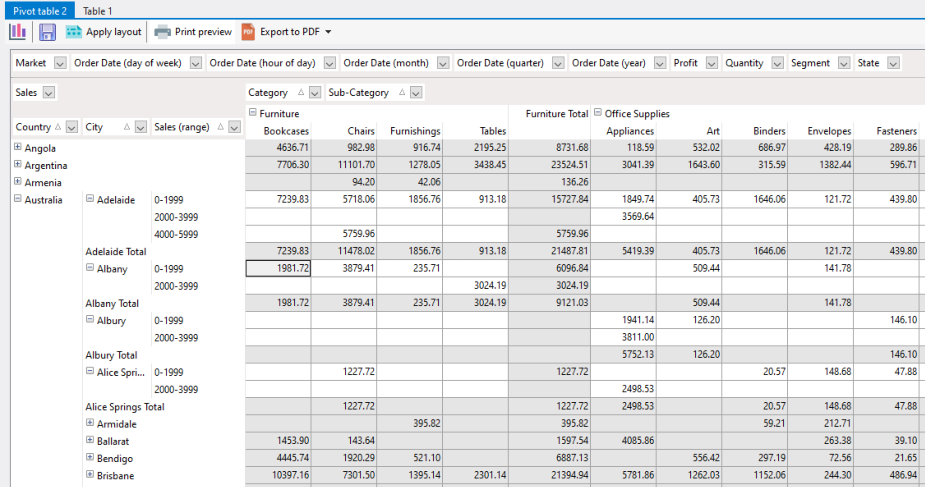
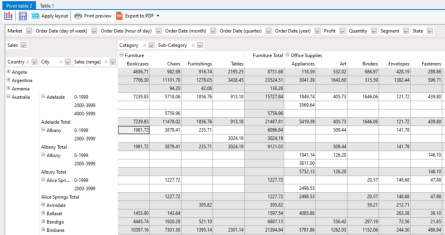
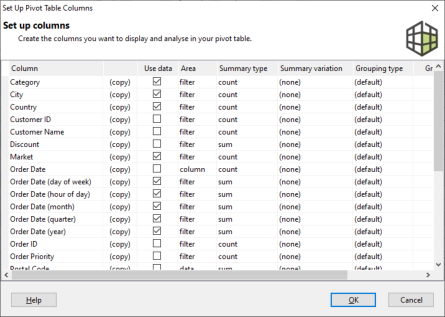
Use pivot tables to analyse your data across various dimensions to gain new insights into your business.
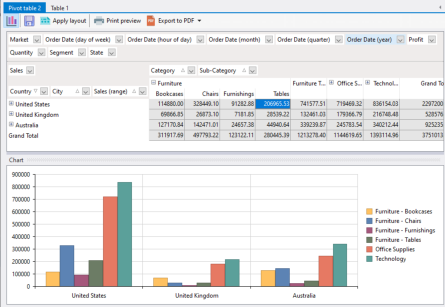
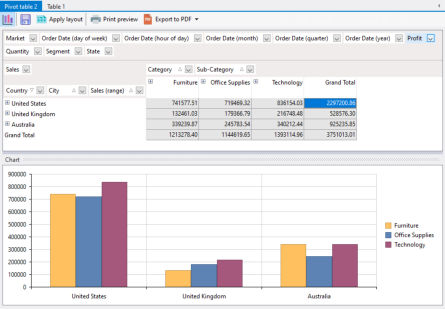
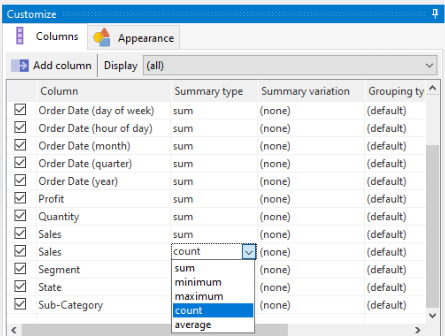
Flexible summaries
Switch summary types just by selecting the function you want, and the pivot table will display your changes immediately.Flexible dimensions
Create as many dimensions as you require to analyze your data. Arrange those dimentions in rows or columns to make new discoveries.Flexible grouping
Group your dimensions’ values using values that help you uncover new trends and patterns.
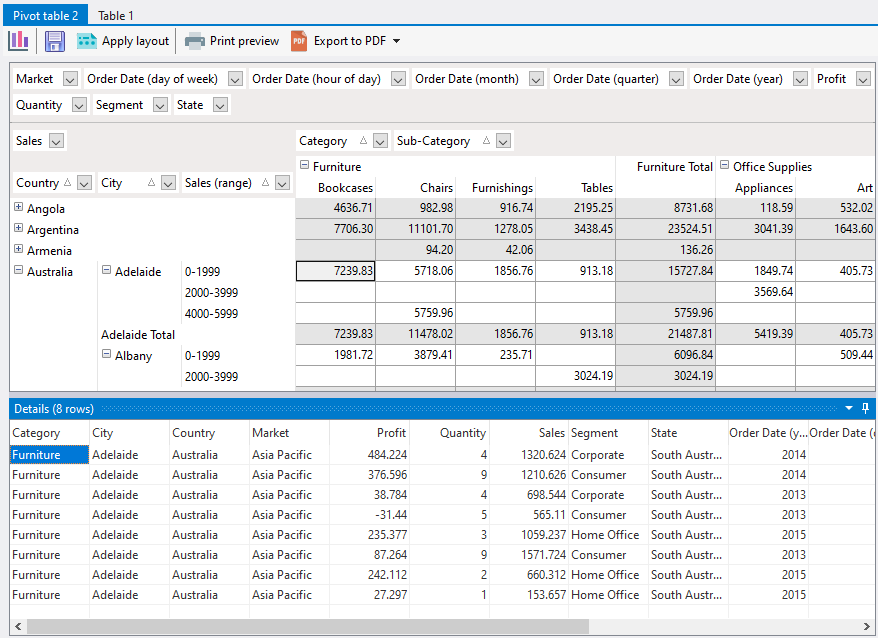
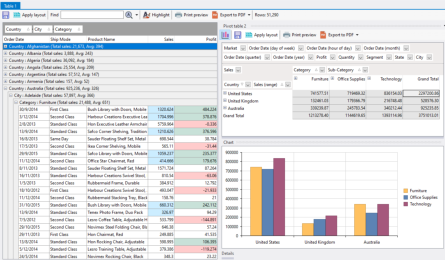
Never lose track of your details
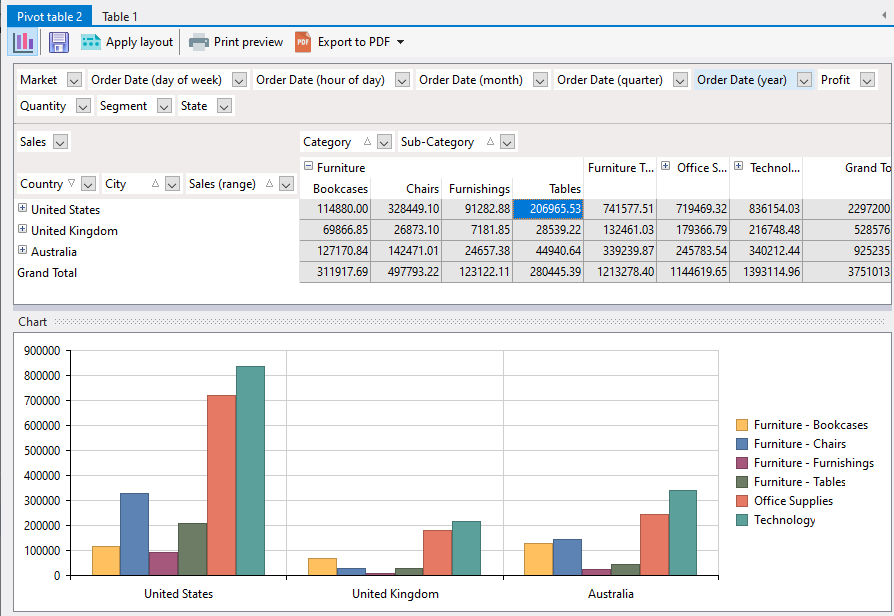
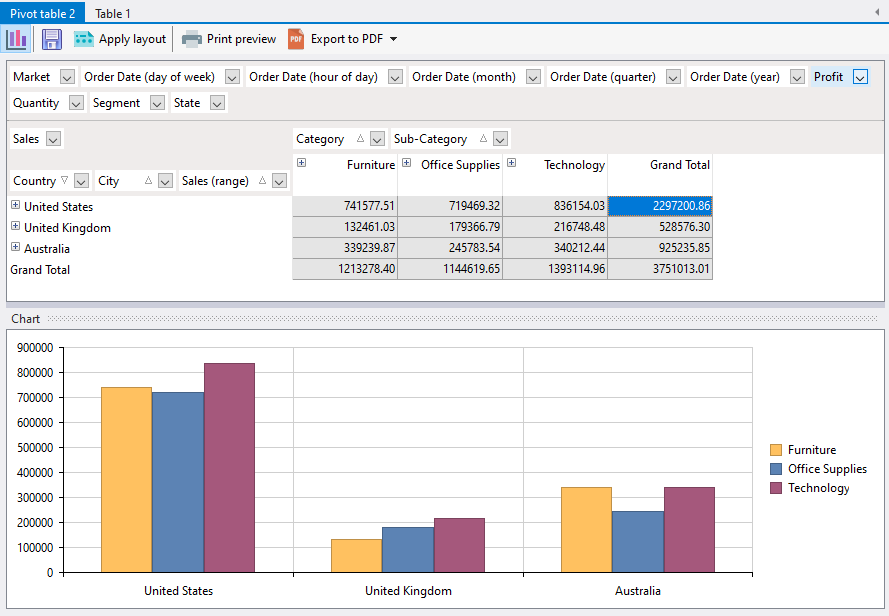
While slicing and dicing your data, you still have full access to the underlying transactional data that makes up your summaries.Visualize using charts
For high-level summaries, you can use charts to quickly compare trends and changes. Charts will change their display depending on you change the layout of the pivot table.Print and export
Print and export your analysis and pivot tables to multiple formats to share your insights. Print or export to PDF, Excel, HTML,
and XML files easily.
Customizable layouts
Arrange the analysis tables, pivot tables, and charts any which way you like.
One application to connect to multiple
database engines
SQL Data Analysis supports the following database engines:Product video


•
PostgreSQL 8.0 onwards
•
MySQL and MariaDB 4.0 onwards
•
Oracle 8.0 onwards
•
SQL Server 7 onwards
•
SQL Server Compact 3.1 onwards
•
SQL Azure
•
SQLite 3.0 onwards
•
Microsoft Access 2000 onwards
•
Firebird 1.x onwards
•
ODBC supported databases

CONTACT US
568-3-53 (3rd Floor), Kompleks Mutiara, 3 1/2 Mile, Jalan Ipoh 51200 Kuala Lumpur, Malaysia 6012 9714904 support@yohz.com https://www.yohz.com
Copyright © 2005 - 2024 Yohz Software,
a division of Yohz Ventures Sdn Bhd.
ALL RIGHTS RESERVED.
All trademarks or registered trademarks are property of their respective owners

View and export images and files from
your databases using
SQL Image Viewer
•
import data sets from your databases using SQL queries
•
analyze your data sets using analysis tables and pivot
tables
•
discover new patterns and trends from your analysis
•
share your discoveries using PDF reports, or export to
Excel, HTML, and XML files


Get actionable insights
from your SQL data sets
the fast and easy way
Sort, filter, group, and summarize your SQL data sets
whichever way YOU need. Transform this:
into this:
Grouping
You can group columns in whichever order you require. This allows you to summarize your data in many possible ways, potentially uncovering new information or patterns.Summaries
Create summaries for any columns, or even multiple summaries for the same column using different functions. View summaries in group headers, group footers, and column footers.Conditional highlighting
Highlight exceptional values using flexible rules and formulas.Sorting
Sort one or more columns in ascending or descending orders, in the sequence you require. In our example, the data is first sorted by Ship Mode, then by Customer Name. The groups (Country, City, Category) are also currently sorted in ascending order.Filtering
Each column can be filtered to display only the data you want to see. You can also apply more complex filtering rules.Pivot tables - new
dimensions revealed
Use pivot tables to analyse your data across various
dimensions to gain new insights into your business.
Flexible summaries
Switch summary types just by selecting the function you want, and the pivot table will display your changes immediately.Flexible dimensions
Create as many dimensions as you require to analyze your data. Arrange those dimentions in rows or columns to make new discoveries.Flexible grouping
Group your dimensions’ values using values that help you
uncover new trends and patterns.
Never lose track of your details
While slicing and dicing your data, you still have full access to the underlying transactional data that makes up your summaries.Visualize using charts
For high-level summaries, you can use charts to quickly compare trends and changes. Charts will change their display depending on you change the layout of the pivot table.Print and export
Print and export your analysis and pivot tables to multiple
formats to share your insights. Print or export to PDF, Excel,
HTML, and XML files easily.
Customizable layouts
Arrange the analysis tables, pivot tables, and charts any
which way you like.
Product video


Data analysis made easy with
SQL Data Analysis